Mastering the System Curve: Unlocking the Full Potential of Pump Systems
Centrifugal pumps are essential across many industries, from water treatment and distribution to oil and gas, playing a crucial role in the efficient transportation of fluids. Understanding the system curve is vital for optimizing pump performance and ensuring energy-efficient operation.
The System Curve
The Hydraulic Institute defines system curve as: A graphical representation showing the total head loss of a system over a range of flow rates.
The system curve illustrates the relationship between flow rate and the total head (TH) that a pump must overcome to deliver water through a system. This contrasts with head, which refers specifically to the amount of energy the pump can provides to transfer water to its destination, as is depicted on a flow and head performance pump curve.
The TH represents the pressure losses due to elevation and friction pressure within a pumping system and is shown on a system curve. It helps operators and engineers understand how different flow rates affect the overall system pressure. The components of TH include:
- Static (Elevation) Head: The vertical distance water needs to be pumped. As the height increases, more energy (pressure) is needed.
- Friction Head: The energy lost in a pumping system due to resistance. As water flows through the system, resistance slows the flow and causes energy loss. Factors such as age, pipe diameter, length, and materials impact friction losses as well as components (valves, fittings, joints, etc.) impact friction head.
“Open System” System Curve
The system curve shows the total losses (Total Head, TH) of a pumping system at different flow rates.
The typical system curve for an open system is plotted with flow rate on the x-axis and head on the y-axis (Image 1).
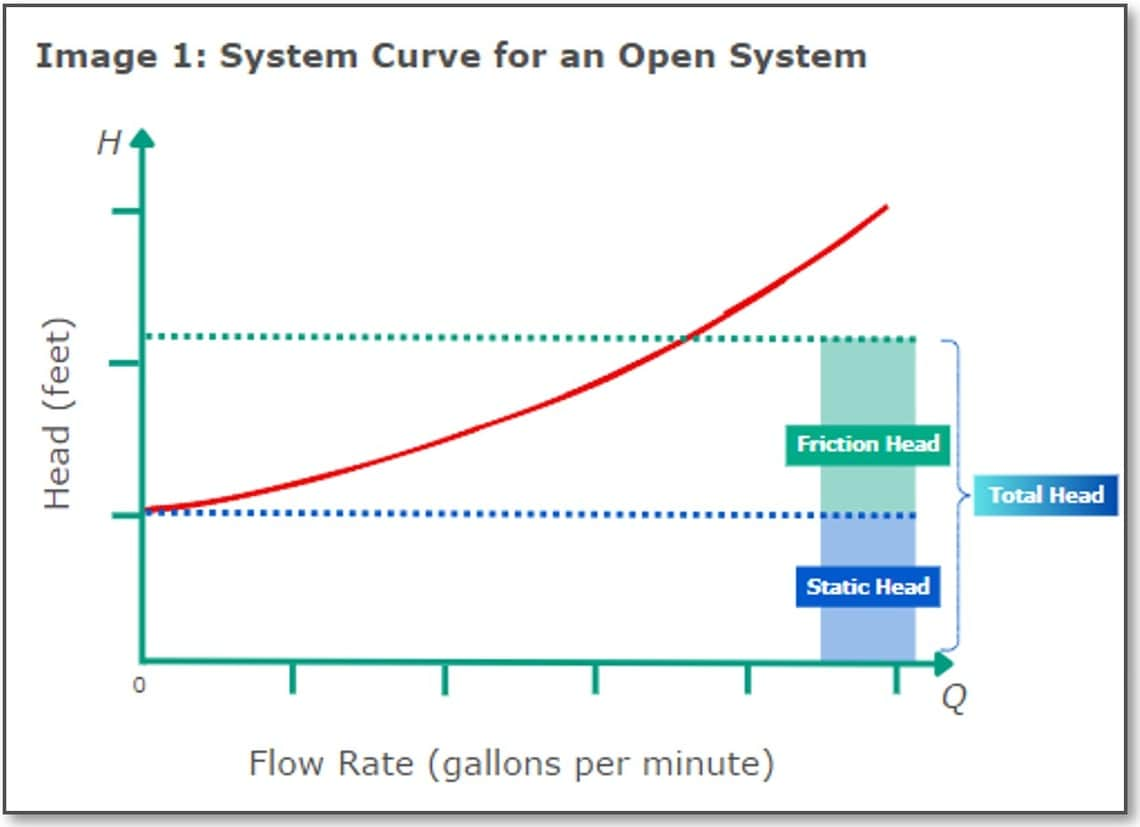
Static head is the height water must be moved and is the difference in elevation from top of the water source at the base of the building to the top of the reservoir tank on the roof. Friction head accounts for all resistance found in the system from fittings, valves, joints, pipe length, pipe diameter, and type of material. The system curve typically starts at the static head value and rises as the flow rates increases due to the added friction head losses (Image 2).
Open systems are pumping systems where the pump is used to transport water from one point to another. These systems are commonly found in applications such as water treatment and distribution, irrigation, and industrial process systems. The most familiar example of an open system is the water piping in a house or office building. In this simplified example (Image 3), water is transported from a water source at the base of the building to a reservoir at the top of a building, with the blue line representing the water flow. In an open-system, water is “exposed” to the atmosphere, usually at final point of discharge, such as a faucet, toilet, or water-using appliance.
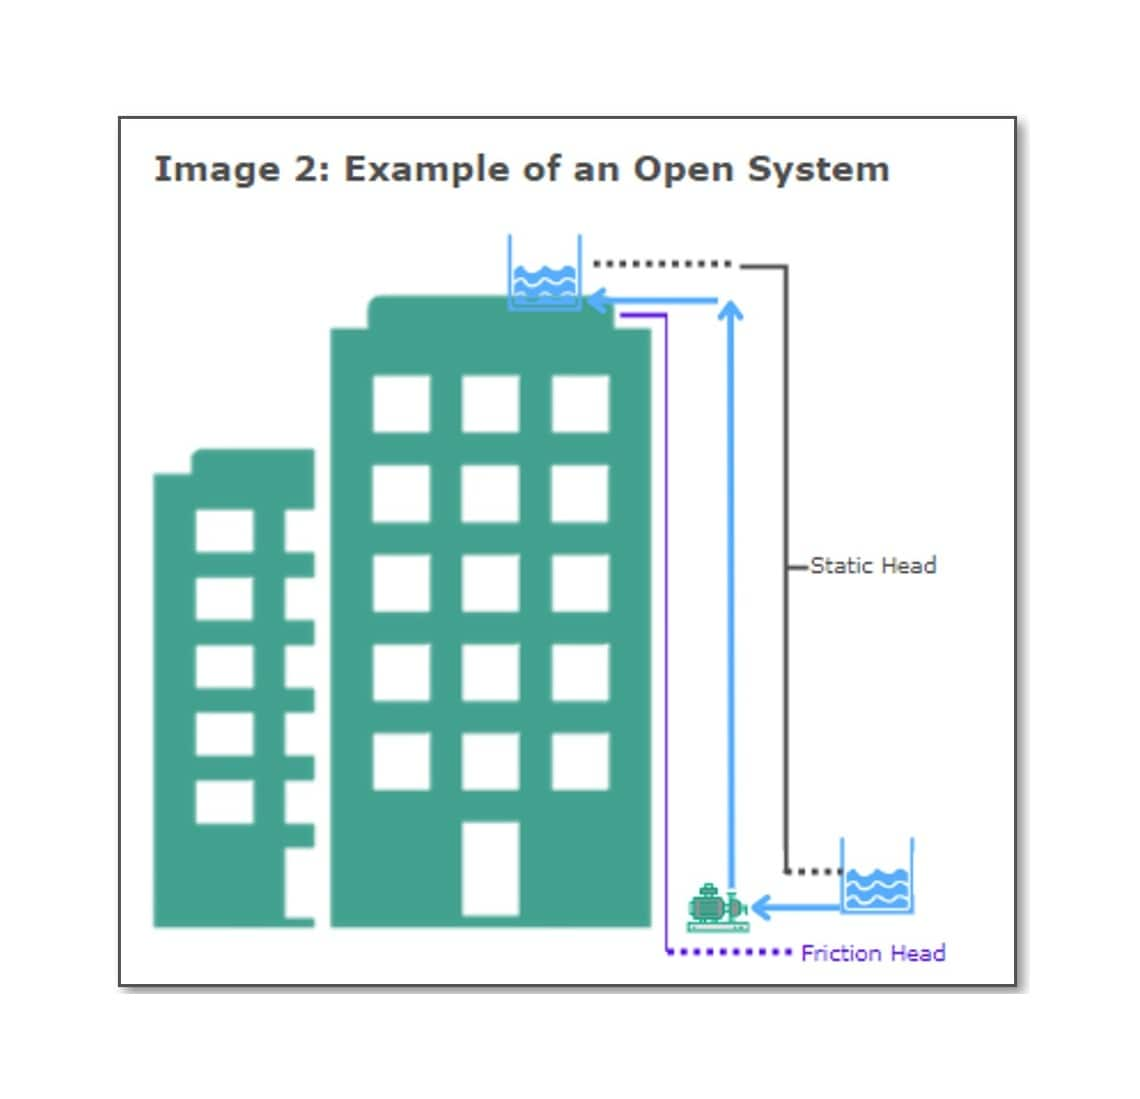
Image 3: An “open system” in a residential building where the water’s final discharge (faucet, toilet, shower, etc.) is “exposed to atmosphere”.

Image 3:
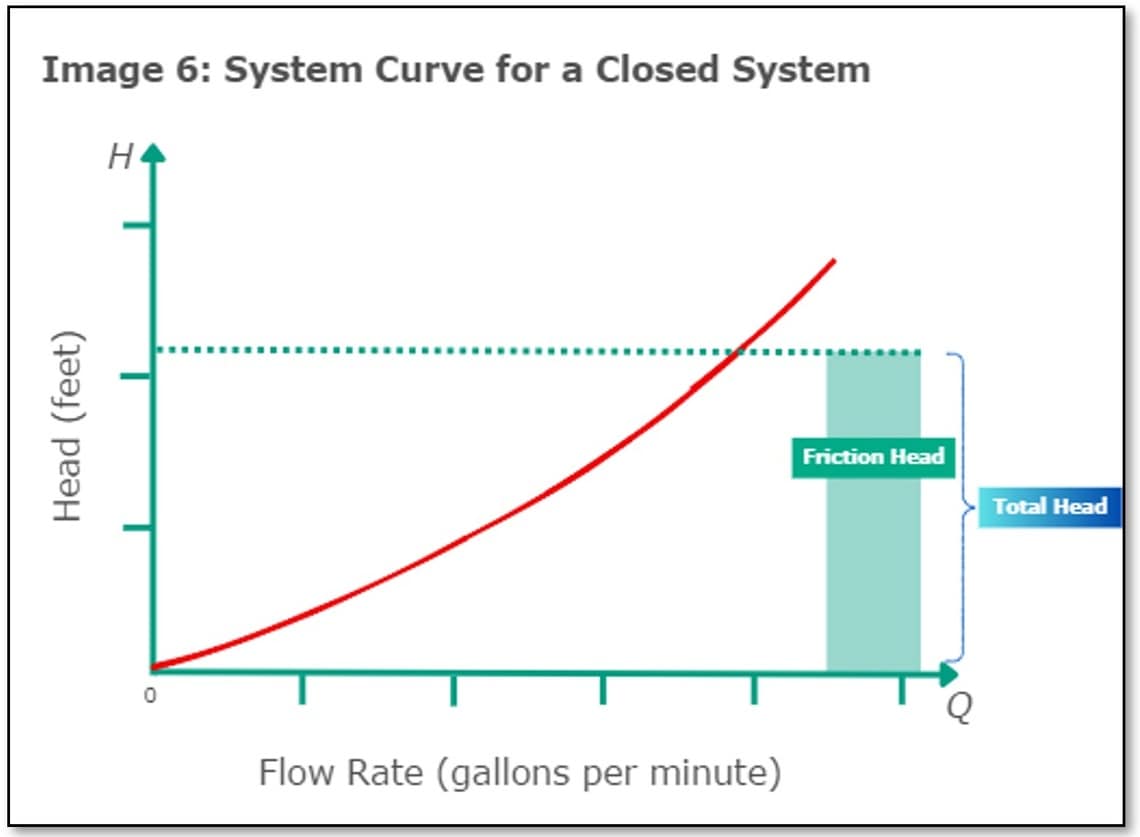
The role of closed systems is to transport the thermal energy. Since there is no static head to overcome, closed systems only must overcome friction head, thus the system curve starts at 0 feet of head (Image 6).
Pump Curve vs System Curve
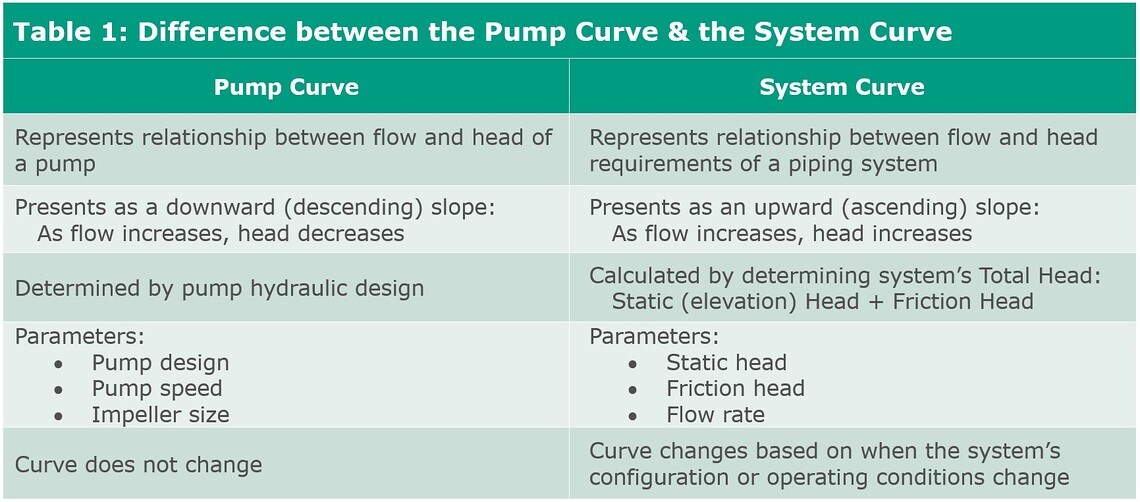
While the system curve (Image 7) represents the TH needed to overcome friction losses a pumping system at various flow rates, the pump curve represents the pump’s ability to move water Image 8). The system curve represents the whole system’s resistance (TH) at different flow rates, while the pump curve represents the head that an individual pump can overcome.
There are several differences between a centrifugal pump curve and system curve (Table 1):
The Relationship Between the System Curve and Pump Performance Curve
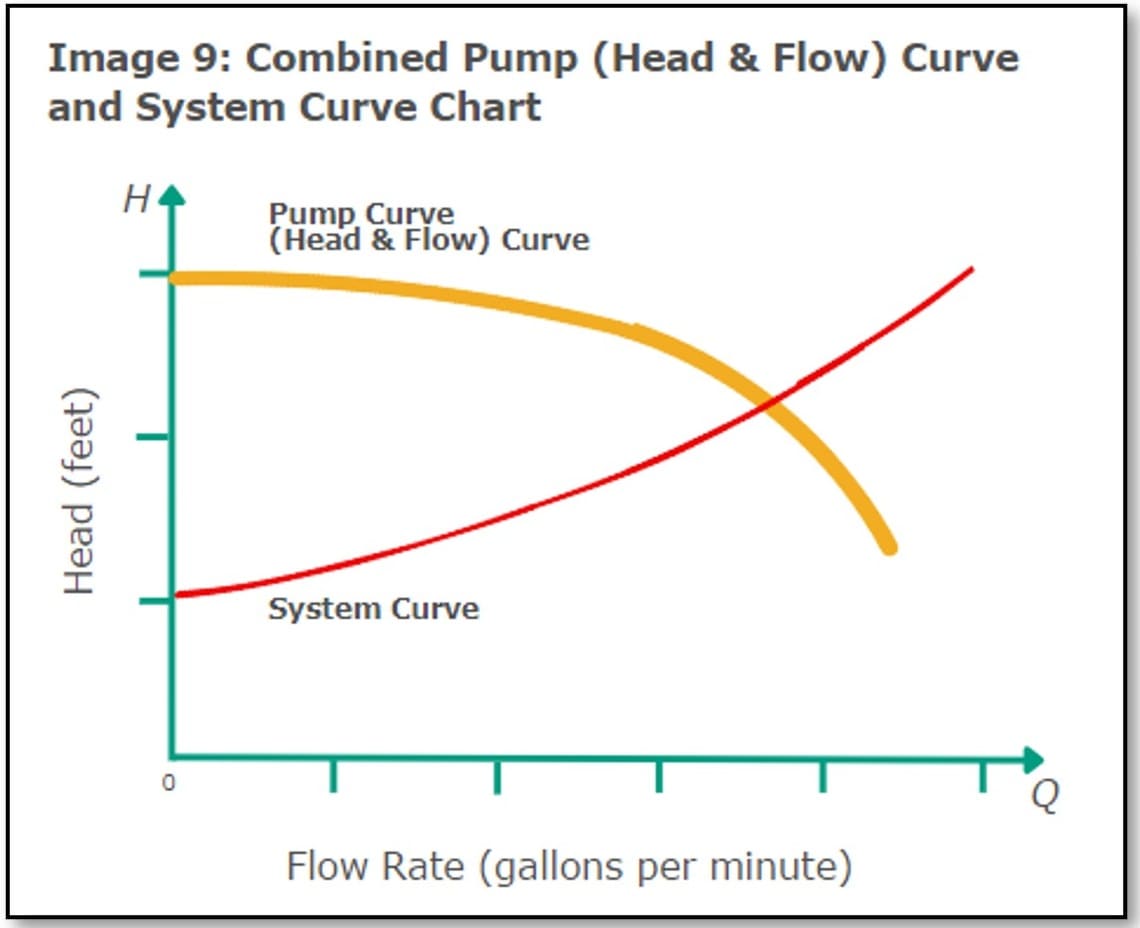
Although the system curve is independent of the pump’s characteristics (design, speed, power, and impeller size), it is crucial to understand how the system curve interacts with the pump curve. The pump curve, shows how much head (pressure) the specified pump can produce at different flow rates, defined by its design, speed, and impeller size. The system curve shows the head required by the system to flow water at different flow rates and is based on calculations of resistance to flow.
The pump and system curves are combined in one chart (Image 9) for pump selection. Together, they show how the flow and head produced by the pump matches the system’s requirement for head. The pump will operate at the point where the pump curve and system curve intersect. If the curves do not intersect, the selected pump is not suitable for the system.
Factors Affecting the System Curve
For a constant speed application, the pump curve does not change. However, the system curve can change due to changes within the system. Changes to the system affect friction loses, thus the system curve shape can change. But as the flow rates changes, the system curve doesn’t change. T duty point just moves to a different point on the curve. (Images 10 and 11).
Changes in flow rate: Higher flow rates can increase friction losses, shifting the system curve upwards.
Changes in total head:
- Variations in system design: Design changes, such as adding components, can alter the system curve.
- Pipe diameter and length: Smaller diameters and longer pipes increase friction losses.
- Surface roughness: All surfaces exhibit some degree of roughness from the relatively smooth interior of copper or PVC pipe to the roughness of concrete pipe.
- Fittings and valves: Objects within the pumping system, like fittings and valves, contribute to friction loss. Each component has a friction loss coefficient that must be included in the tally of friction losses.
As the pump system ages, pipes can corrode and oxidation and deposition (scale) can increase friction loss, changing the system requirement over time.
Optimizing Pump Performance Using the System Curve
To achieve optimal pump performance, consider the following strategies:
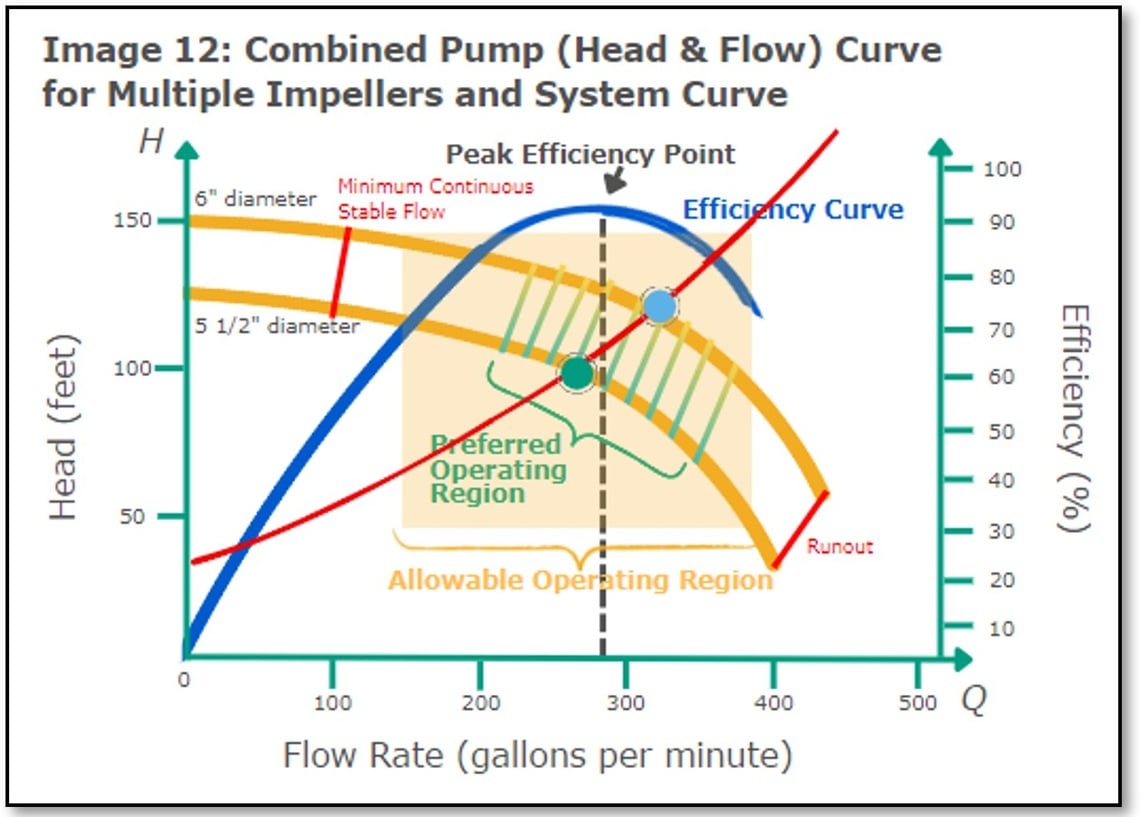
- Adjust pump speed and impeller size: Varying the pump speed and impeller size can shift the pump curve to better match the system curve. In the example (Image 12), the 5 ½” impeller is the better choice over a 6” diameter impeller because the smaller impeller’s operating point (green point) along the system curve is closer to the Best Efficiency Point (BEP) than the larger 6” diameter impeller’s operating point (blue point).
- Minimize friction losses: Use smoother pipes, reduce pipe length, reduce velocity, increse pipe size, or optimize lower friction losses.
- Best practices for system design and maintenace: Regularly inspect and maintain the system to ensure minimal resistance (friction loss) and optimal performance.
Wilo is Your Solutions Provider
Understanding and optimizing the system curve is essential for achieving efficient and reliable pump performance. By regularly monitoring the system curve, operators can ensure their pumps run smoothly, save energy, and reduce operational costs.
The expert team of engineers at Wilo USA can help you understand the system curve to unlock the full potential of your pump systems. Reach out to us with your queries, and we will assist you in selecting the ideal pump to suit your system’s requirements and application.
October 2024 | tlk


